Keep up with the latest cybersecurity threats, newly discovered vulnerabilities, data breach information, and emerging trends. Delivered daily or weekly right to your email inbox.
Creating Your Own Threat Intel Through ‘Hunting’ & Visualization
How security analysts armed with a visual interface can use data science to find hidden attacks and the ‘unknown unknowns.’
5 Min Read
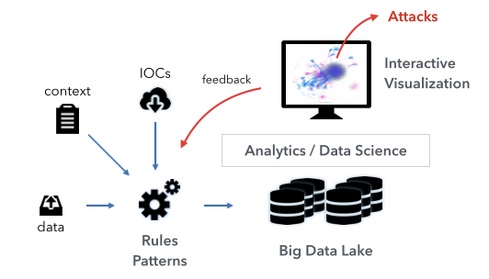
Simplified data flow that supports the hunting process through interactive visualization.
As 'cyber defenders' we can no longer work with external threat intelligence alone. We have to stop relying on how attacks have been conducted in the past and start hunting for signs of compromises and anomalies in our environments. This is the only way that we have a fighting chance to find advanced perpetrators.
While I don't have a silver bullet, my recent observations have shown that traditional security devices like firewalls, intrusion detection systems, security information event management (SIEM), and most notably anti virus are all based on signatures -- knowledge of past attacks and methods. Back in the days of script kiddies and worms, those approaches worked fairly well. But the threat landscape has changed drastically. Today’s attacks are surgically planned and executed by very skilled adversaries. No two attacks are the same. And even worse, there is an entire industry of cybercriminals who make money by selling services and custom attack code, making it possible for anyone to become an "advanced adversary."
The problem with threat intel
Many companies today subscribe to some sort of threat intelligence feeds. They often get lists of malicious IP addresses and other indicators of compromise (IOC). These IOCs have the same problems as the attack signatures from yesterday because indicators are only useful for broad-stroke attacks where maybe an entire industry is hit with the same malware. It won't help if you are dealing with a targeted attack that concerns only your company.
So what can you do? Generate your own threat intelligence by going on the hunt! Hunting is a tremendous asset for threat intelligence teams, letting security analysts look for signs of anomalies and attacks in as much data (logs) as they can get their hands on. The hunting function is one that relies on both security analysts’ knowledge of their organization and environment and their security experience. Hunting is not about algorithms or pre-canned rules and signatures that describe past attacks. For effective hunting, in addition to good analysts, you also need data and some analytical capabilities. This is not a tool you download off the Internet or buy off the shelf.
[Learn more from Raffael about using visual analytics to deliver actionable security intelligence during his training sessions at Black Hat 2015, Las Vegas August 1-2 & 3-4.]
Where to begin
Start with collecting as much data as you can. Get data from your SIEM, your log management tools, log files, etc. and collect it in a big data lake. If you already have a columnar data store containing your security data, that's a great starting point. If you don't, go get one. For scalability I recommend storing your data on Hadoop in a columnar data format. Unfortunately, your SIEM is not suited for hunting. It doesn't have the right scalability and is too closed off when it comes to adding analytics and visualization on top of it (see below).
Once the data is in a fast data store, you are ready to let the analysts interact with the data. Don't expose your analysts to the textual data and have them write SQL queries. You want to empower your analysts, not slow them down. Give them a visual interface to interactively explore the data. Visually displaying large amounts of data requires the use of aggregation. We simply don't have enough pixels to display all of the data. This falls in the camp of data science with summarization on the one end of the spectrum and complex unsupervised learning algorithms on the other end. In any case, make sure the data science complexities are staying hidden from the analysts. You don't want them having to understand how these complex algorithms work. You need your analysts to be experts in security.

A visualization of network traffic using a data science approach to color and plot traffic based on its similarity.
The unknown unknowns
The hunting or exploratory process is all about finding unknown and hidden attacks. If you already know what you are looking for, visualization can help identify those instances quicker and easier, but generally, visualization is used to find the unknown unknowns. Once identified, the unknowns then get translated into one of the traditional analytics approaches: rules, statistics, or behaviors. This way we can automate the process of finding them in the future.
Some of the insights the hunting process discovers can't be described with a traditional analytics approach. The parameters are not clear or change ever so slightly. However, visually those outliers are quite apparent. In those cases it is necessary to continue using visualization on a regular basis to keep finding new instances of the same type of attacks. Below is a visual representation of end point data from a simple "hunt" that uncovered rogue DNS traffic used to exfiltrate information.


Graph 1 is a representation of how processes on an end point interact with external machines. The bar chart on the left shows the ports used in the communications. Graph 2 shows a zoom in on the DNS traffic, which is highlighted in red. Instead of using the default DNS server, we see that Chrome used a secondary DNS server as well. In a further drill down into the original records below, we see in Graph 3 the exact details of the traffic.

Read more about:
Black Hat NewsAbout the Author(s)
You May Also Like
More Insights
Webinars
Key Findings from the State of AppSec Report 2024
May 7, 2024Is AI Identifying Threats to Your Network?
May 14, 2024Where and Why Threat Intelligence Makes Sense for Your Enterprise Security Strategy
May 15, 2024Safeguarding Political Campaigns: Defending Against Mass Phishing Attacks
May 16, 2024Why Effective Asset Management is Critical to Enterprise Cybersecurity
May 21, 2024
Events
Black Hat USA - August 3-8 - Learn More
August 3, 2024Cybersecurity's Hottest New Technologies: What You Need To Know
March 21, 2024